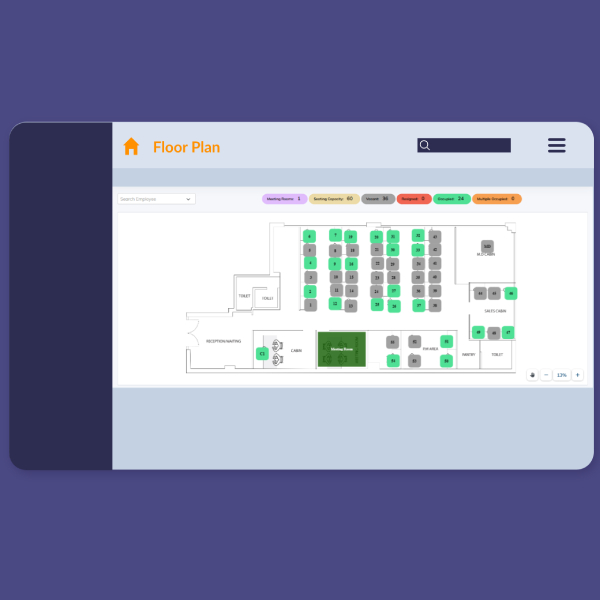
Interactive Floor Plan Mapping – Upload floor plan images and intuitively map seating arrangements with a simple interactive interface.
Smart Meeting Room Booking & Availability Status – Reserve or cancel meeting rooms in just a few clicks with real-time room availability and calendar sync.
Streamlined Employee Management – Manage employee details, seating assignments and search employee seating from one centralized dashboard..
Visitor Booking & Check-in – Pre-book visitors and assign them temporary seats or meeting rooms which enhance security with digital check-ins.
Centralized Workspace Visibility – One platform to monitor and manage regular seating, hot seating, meeting room usage, and personnel allocation which improves space optimization and cost-efficiency.
Data-Driven Insights – Gain insights into meeting room usage, seating occupancy, and employee footfall across all your office locations for better space planning and resource allocation.
Seamless Collaboration & Planning – Ideal for all models like hybrid or dynamic office or traditional fixed office models.
End-to-End Lead Management & Analytics – Capture, track, and analyze leads from all major channels—Facebook, Instagram, Google Ads, direct, and organic.
Comprehensive Sales Analytics – Real-time visibility into sales performance across projects, teams, and campaigns.
Project-Centric Brokerage Management – Manage brokerage per project with clarity—track commissions, disbursements, and pending payments.
Receivable Brokerage & Payout Visibility – Monitor brokerage receivables in real-time and track payment stages effortlessly with clear receivable vs. received reporting.
Brokerage Sharing Automation – Split brokerage between internal employees or external brokers with smart allocation logic to streamline compliance and commission tracking.
Dynamic Team & Hierarchy Management – Configure and manage sales hierarchies, from executives to zonal heads to enable team-level performance tracking and comparative analytics.
Centralized Project Oversight – Manage multiple projects with unified dashboards—track inventory, sales, leads, and brokerage at the project level with effortless management for high-volume real estate businesses.
Lead Conversation Intelligence – Analyze how leads are handled through stages—from first contact to closure to improve your team’s engagement and follow-up strategies.
Data-Driven Decision Making – Make faster, smarter decisions with powerful visualizations, trend lines, and KPIs with the help of customizable dashboards tailored to C-level executives, sales leaders, or brokers.
Real-Time Collaboration & Transparency – Keep marketing, sales, and finance teams on the same page with synchronized data views by sharing dashboards and reports across departments.
Team Performance & Lead Conversion Analytics – Track sales team effectiveness based on lead conversion rates over the last 30 days or any defined period.
Net Premium Intelligence Dashboard – Monitor net premium collections with dynamic filters by policy type, region, or agent.
Renewal Pipeline Visibility – Gain clear insights into upcoming and missed renewals to drive proactive client retention strategies.
Brokerage Receivable & Realization Tracker – Stay on top of expected and received brokerage with real-time reconciliation views.
Ageing Analysis & Recovery Monitoring – Identify outstanding premiums and receivables categorized by age brackets for effective follow-ups.
Agent Call Analytics Dashboard – Evaluate agent performance with metrics like total calls, connected calls, and NCR (No Contact Ratio).
Role-Based Dashboards for Sales, Ops & Management – Provide focused insights to each stakeholder with tailored visualizations for action-oriented decisions.
Custom Time-Period Trend Analysis – Analyze performance across custom timeframes to identify short-term trends and long-term patterns.
Policy Growth & Revenue Attribution Reports – Attribute net revenue to specific agents, teams, or campaigns for optimized planning and rewards.
Integrated Renewal & Follow-Up Alerts – Automate alerts for policy renewals, overdue brokerage, or low-performing agents.
Complete Lead Journey Overview – The dashboard offers a complete view of every lead’s journey, showing call outcomes such as connected, not interested, call back, not eligible, and more, ensuring follow-ups are timely and effective.
Real-Time Call Status Tracking – It provides real-time analytics of call status to help optimize calling strategies and increase connection rates.
Source-Wise Lead Conversion Analysis – Users can easily track which lead sources—like Meta, Google, Landing Pages, WhatsApp, or Facebook—are delivering the highest conversion rates, helping to focus marketing efforts.
Detailed Sub-Source Performance Insights – Lead sub-sources are clearly broken down, enabling teams to evaluate performance at a granular level and understand which digital touchpoints are working best.
Connected Call Percentage Monitoring – Connected call percentage is automatically calculated, helping teams identify how well their outreach is performing and where improvements can be made.
Meta vs Digital Marketing Campaign Comparison – Performance comparison between Meta and other digital marketing sources is made simple with side-by-side metrics like total leads, connected calls, and conversion rates.
First Interaction vs Total Calls Analysis – The dashboard captures and compares the first interaction (first call attempt) against total calls and mobile numbers, offering insight into lead response and team effectiveness.
Lead Segmentation by Final Status – Lead data is segmented based on outcomes like wrong number, not interested, scheduled meeting, and won, making it easier to tailor follow-ups and campaign strategies.
Total Call Volume and Engagement Metrics – It includes a total call volume report with filters for connected vs not connected calls, helping to evaluate team productivity and data quality.
Advanced Filtering and Drill-Down Capabilities – Smart filters allow users to break down reports by date, lead source, sub-source, campaign, and lead status for custom analysis and fast decision-making.
Comprehensive Employee Lifecycle Tracking – Get complete visibility into the employee journey — from joining to resignation — including buckets like 0–3 months, 3–6 months, and beyond. Make informed decisions on hiring, onboarding, and retention strategies.
Real-Time Active Employee Snapshot – Instantly view live headcount of active employees across departments, locations, or pay groups — helping HR and leadership stay on top of workforce availability at any time.
30–90 Day New Joiner Trends – Analyze joining patterns across 30, 60, and 90 days, enabling HR to assess recruitment cycles, onboarding effectiveness, and short-term retention health.
Detailed Resignation Analytics – Access in-depth resigned employee records, including tenure, department, vertical, and manager, helping pinpoint high-attrition zones and uncover actionable trends.
Pay Group & Vertical Mapping – Easily identify employees by pay group and vertical, empowering finance and HR teams to align compensation strategies and departmental budgets accurately.
Unified Employee Master Data – Consolidated view of critical information like Employee ID, Reporting Manager, Department, Location, and Joining Date, all in one centralized, searchable dashboard.
Custom Tenure Bucketing – Get insights by grouping employees into custom tenure buckets (e.g., 0–3 months, 3–6 months, etc.), aiding in probation tracking, early attrition analysis, and engagement planning.
Seamless Cross-Departmental Insights – Enable business unit leaders and HR to filter employee metrics by department, vertical, or location, providing operational clarity and reducing information silos.
Resignation-to-Joining Ratio Analysis – Track patterns between resigned and newly joined employees over time to assess if workforce replenishment is aligned with company growth and attrition rates.
Data-Driven HR Strategy – With interactive dashboards and drill-down capabilities, empower HR leaders to shift from reactive to proactive decision-making — whether it’s hiring, restructuring, or retention.